8 hours of work for a System or Network Administrator can be one of their worst since monitoring and debugging Linux system performance programs on a daily basis is one of the most challenging tasks. The work of a Linux administrator can be a bit tedious as it may require a lot of time, hard work, and patience to keep the systems up and running. However, Linux got very useful tools called Linux Performance Tools which allow a system or network administrator to keep track of their Linux system resources and storage usage in an easier and more reliable manner.
In this tutorial, we have come up with the top 10 most used command-line tools used to Monitor Linux Server Performance.
1. top (Table of Processes)
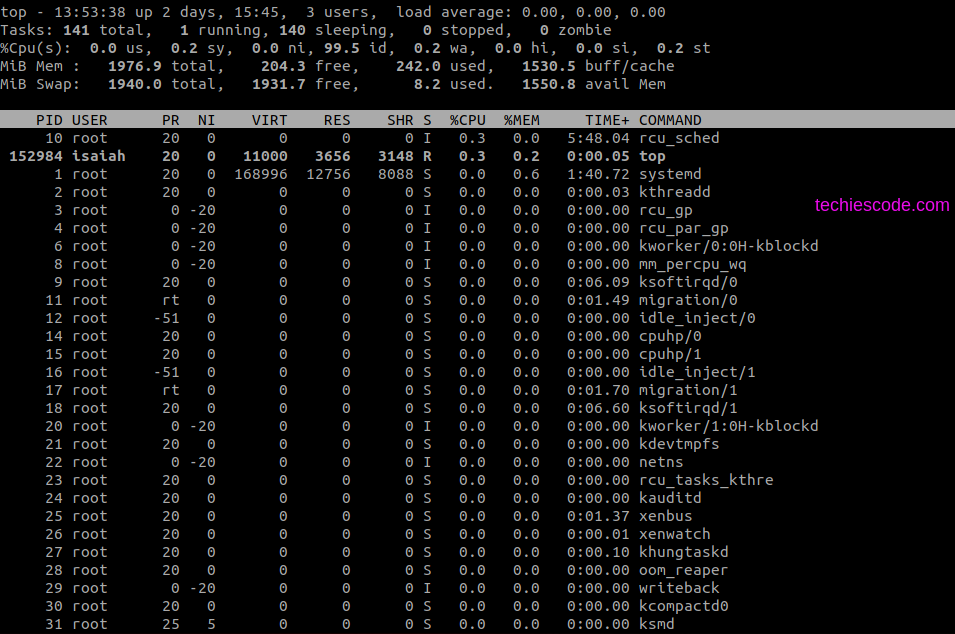
Top (table of processes) is one of the most commonly used command-line tools worldwide by Linux System Administrators. It is a performance program used to monitor processes and system resource usage in Linux. It displays information about the current processes using the CPU and also the memory used by each process together with the used and available memory. The top command also shows the process ID of each process.
The top command can be installed by the command below.
$ sudo apt install topNow, let’s run it.
$ top
2. htop
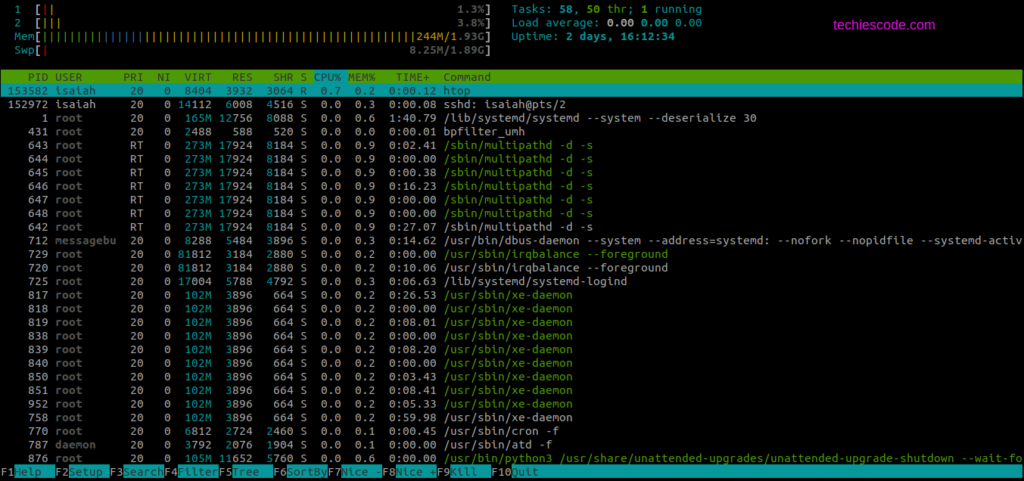
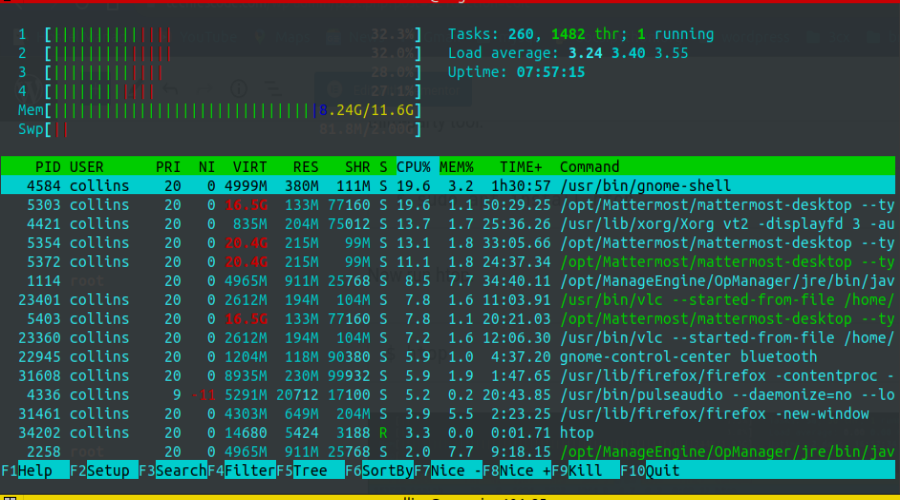
Also referred to as Linux process monitoring, htop is a much more advanced tool similar to Linux top command but it has some rich factors like shortcut keys, a user-friendly interface to manage processes, vertical and horizontal views of the processes, and much more. The best part of it is that the user-friendly interface allows you to kill and adjust the system processes according to their priorities without the need to leave the htop interface because it supports mouse operations.
You need to install htop on your machine since it does not come with the Linux system because it is a third-party tool.
$ sudo apt install htopNow run htop.
$ htop
3. iotop
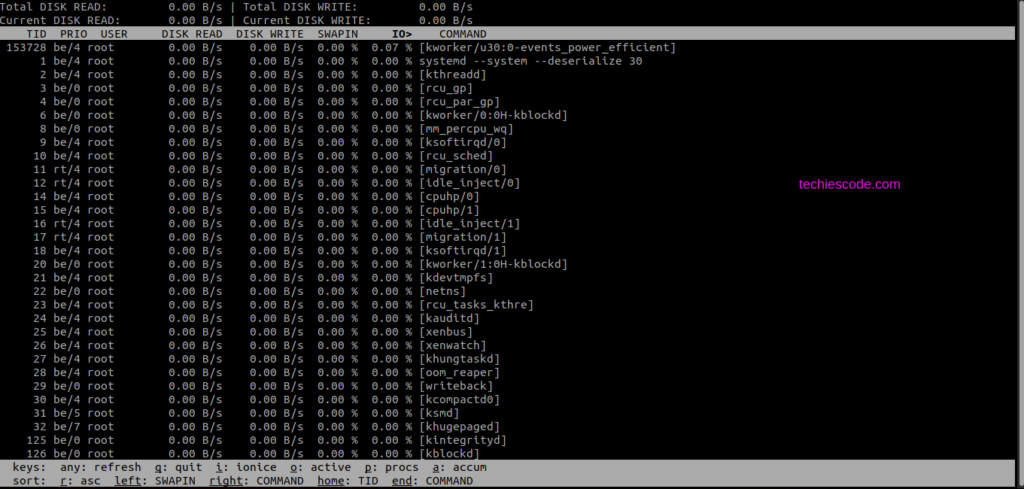
Iotop is a free python-based utility that allows system admins to monitor disk I/O (input/output) usage details. With the use of iotop, system admins can easily identify the process that is causing a lot of I/O rewrites to the server because iotop provides detail for a specific thread or a process in the system. And that is one advantage of iotop over the top and htop command even though they are similar.
Just like the htop command, iotop does not come with the Linux system therefore you need to install it. Type in the following command to install.
$ sudo apt install iotopTo access iotop, you should log in as root to be able to access certain privileges.
# iotopA sample screen of iotop is shown below.

4. vmstat – Virtual Memory Statistics
Vmstat is a command-line utility used to display virtual memory statistics. With vmstat, you will be able to display a lot of information including all system processes, memory, paging, and block I/O. it further gives you detailed information bout how much swap memory is being used, and the number of I/O operations in process and also gives information about CPU utilization.
Vmstat is a built-in tool in most Linux distributions, therefore you have no need to install it, you can run it straight away.
$ vmstatprocs -----------memory---------- ---swap-- -----io---- -system-- ----cpu-----
r bsp b swpd free buff cache si so bi bo in cs us sy id wa st
1 0 8448 198848 163044 1411220 0 0 13 26 15 44 0 0 99 0 0
5. Lsof – list open files
Many Linux systems use the lsof command to display all current files opened in the system which may include network sockets, disk files, pipes, devices, and processes. One major advantage of this command is that it helps system administrators to see the files currently in use in cases where the disk can not be unmounted. This makes it very easier for such files to be found.
The Lsof command needs to be installed since it does not come inbuilt with Linux system distributors. To install lsof on Ubuntu, type the following command in your terminal and hit enter.
sudo apt install lsofTo use the command, enter lsof.
$ lsofsystemd 57487 isaiah mem REG 253,0 202760 6650 /usr/lib/x86_64-linux-gnu/libcrypt.so.1.1.0
systemd 57487 isaiah mem REG 253,0 31120 6647 /usr/lib/x86_64-linux-gnu/libcap.so.2.32
systemd 57487 isaiah mem REG 253,0 351352 1535 /usr/lib/x86_64-linux-gnu/libblkid.so.1.1.0
systemd 57487 isaiah mem REG 253,0 39088 6622 /usr/lib/x86_64-linux-gnu/libacl.so.1.1.2253
systemd 57487 isaiah mem REG 253,0 80736 598 /usr/lib/x86_64-linux-gnu/libapparmor.so.1.6.1
systemd 57487 isaiah mem REG 253,0 104656 6741 /usr/lib/x86_64-linux-gnu/libkmod.so.2.3.5
systemd 57487 isaiah mem REG 253,0 133200 6636 /usr/lib/x86_64-linux-gnu/libaudit.so.1.0.0
systemd 57487 isaiah mem REG 253,0 68320 82 /usr/lib/x86_64-linux-gnu/libpam.so.0.84.2
systemd 57487 isaiah mem REG 253,0 387768 834 /usr/lib/x86_64-linux-gnu/libmount.so.1.1.0
systemd 57487 isaiah mem REG 253,0 163200 6825 /usr/lib/x86_64-linux-gnu/libselinux.so.1
systemd 57487 isaiah mem REG 253,0 133568 938 /usr/lib/x86_64-linux-gnu/libseccomp.so.2.5.1
systemd 57487 isaiah mem REG 253,0 35928 2391 /usr/lib/x86_64-linux-gnu/librt-2.31.so
systemd 57487 isaiah mem REG 253,0 2454472 2661 /usr/lib/systemd/libsystemd-shared-245.so
systemd 57487 isaiah mem REG 253,0 2029560 2374 /usr/lib/x86_64-linux-gnu/libc-2.31.so
systemd 57487 isaiah mem REG 253,0 191472 2368 /usr/lib/x86_64-linux-gnu/ld-2.31.so
systemd 57487 isaiah 0r CHR 1,3 0t0 6 /dev/null
systemd 57487 isaiah 1u unix 0x0000000000000000 0t0 104661 type=STREAM
systemd 57487 isaiah 2u unix 0x0000000000000000 0t0 104661 type=STREAM
systemd 57487 isaiah 3u unix 0x0000000000000000 0t0 103932 type=DGRAM
systemd 57487 isaiah 4u a_inode 0,14 0 10502 [eventpoll]
systemd 57487 isaiah 5u a_inode 0,14 0 10502 [signalfd]
6. Netstat – network statistics
Netstat is one of the oldest command-line tools used for monitoring incoming and outgoing network packet statistics as well as interface statistics. With the use of the netstat command, we can easily troubleshoot any network-related problem quickly. Netstat is not part of the latest Linux distributions therefore there is a need to install it first.
$ sudo apt install net-toolsNow run the following command to list all tcp connections on your Linux system,
$ netstat -tunlpActive Internet connections (only servers)
Proto Recv-Q Send-Q Local Address Foreign Address State PID/Program name
tcp 0 0 127.0.0.53:53 0.0.0.0:* LISTEN 26791/systemd-resol
tcp 0 0 0.0.0.0:22 0.0.0.0:* LISTEN 28585/sshd: /usr/sb
tcp 0 0 127.0.0.1:6010 0.0.0.0:* LISTEN 1713/sshd: amani@p
tcp 0 0 127.0.0.1:6011 0.0.0.0:* LISTEN 57662/sshd: isaiah@
tcp6 0 0 :::21 :::* LISTEN 61872/vsftpd
tcp6 0 0 :::22 :::* LISTEN 28585/sshd: /usr/sb
tcp6 0 0 ::1:6010 :::* LISTEN 1713/sshd: amani@p
tcp6 0 0 ::1:6011 :::* LISTEN 57662/sshd: isaiah@
udp 0 0 127.0.0.53:53 0.0.0.0:* 26791/systemd-resol
udp 0 0 192.132.11.5:68 0.0.0.0:* 26765/systemd-netwo
udp 0 0 192.132.11.5:123 0.0.0.0:* 20453/ntpd
udp 0 0 127.0.0.1:123 0.0.0.0:* 20453/ntpd
udp 0 0 0.0.0.0:123 0.0.0.0:* 20453/ntpd
udp 0 0 0.0.0.0:5353 0.0.0.0:* 70506/avahi-daemon:
udp 0 0 0.0.0.0:40605 0.0.0.0:* 70506/avahi-daemon:
udp6 0 0 fe80::3eff:fe55:17:322 :::* 20453/ntpd
udp6 0 0 ::1:123 :::* 20453/ntpd
udp6 0 0 :::123 :::* 20453/ntpd
udp6 0 0 :::5353 :::* 70506/avahi-daemon:
udp6 0 0 :::34469 :::* 70506/avahi-daemon:
root@vpc-vm-test:~#
7. Iostat
Iostat is a simple Linux command-line tool that displays detailed statistics about the systems input/output for both devices and partitions. This tool is often used to trace storage device performance issues including devices, local disks, and remote disks such as NFS.
To install iostat, you should first install a package called sysstat as shown;
$ sudo apt-get install sysstatNow run the iostat command
$ iostatLinux 5.4.0-29-generic (vpc-vm-test) 05/04/22 _x86_64_ (2 CPU)
avg-cpu: %user %nice %system %iowait %steal %idle
0.25 0.01 0.27 0.36 0.39 98.72
Device tps kB_read/s kB_wrtn/s kB_dscd/s kB_read kB_wrtn kB_dscd
dm-0 6.38 7.19 48.85 0.00 1892683 12853840 0
loop0 0.01 0.02 0.00 0.00 4783 0 0
loop1 0.00 0.01 0.00 0.00 2682 0 0
loop2 0.00 0.01 0.00 0.00 2662 0 0
loop3 0.00 0.01 0.00 0.00 2846 0 0
loop4 0.00 0.01 0.00 0.00 2056 0 0
loop5 0.16 0.17 0.00 0.00 44374 0 0
loop6 0.00 0.01 0.00 0.00 1373 0 0
loop7 0.00 0.01 0.00 0.00 2731 0 0
xvda 5.29 23.92 49.06 0.00 6295427 12910124 0
8. Tcpdump -network packet analyzer
Tcpdump is an open-source command-line packet mostly commonly used worldwide that captures TCP/IP packets transferred over the network over a specified interface. It also provides an option to save captured packages in a file for later analysis. Most latest Linux distributors got a built-in tcpdump command-line tool, run the command below to display it.
$ tcpdump -i eth0In case tcpdump is not installed on your machine, you will have to install it manually using the commands below.
sudo apt-get update
sudo apt-get install tcpdump
You can now list the available interfaces to begin the network capture process;
$ sudo tcpdump -D1.eth0 [Up, Running]
2.lo [Up, Running, Loopback]
3.any (Pseudo-device that captures on all interfaces) [Up, Running]
4.bluetooth-monitor (Bluetooth Linux Monitor) [none]
5.nflog (Linux netfilter log (NFLOG) interface) [none]
6.nfqueue (Linux netfilter queue (NFQUEUE) interface) [none]
Now run tcpdump
$ tcpdump -i eth09. Iftop -network bandwidth monitoring
It is a terminal-based free open source system monitoring utility. It can display network activities on an interface.
By default, iftop is installed in most Linux distributors.
Just in case your machine doesn’t have iftop, install it using the command below;
$ sudo apt install iftopNow run it,
$ iftopinterface: eth0
IP address is: 192.112.4.6
MAC address is: 02:20:3e:3:00:17
pcap_open_live(eth0): eth0: You don't have permission to capture on that device (socket: Operation not permitted)
10. Free
This command displays the total amount of free and used memory(RAM). The free command also displays the swap memory as well as the buffers used by the kernel.
Using the following command, you should be able to display the Linux memory usage.
$ freeisaiahmatin@isaiah:~$ free
total used free shared buff/cache available
Mem: 3897332 1778328 1368228 231840 750776 1646588
Swap: 2097148 852880 1244268
conclusion
The above tools are some of the most commonly used command-line tools in the Linux server world. We hope you find this tutorial interesting. Thank you!


One thought on “Best Tools To Use In Monitor Linux Systems Performance”