

Grafana is a tool for monitoring, analyzing, and visualizing of current system data. It generates graphs and dashboards from a time-series database (Graphite, InfluxDB, or OpenTSDB).
Grafana is a data visualization and monitoring tool that allows users to create and edit both log and data graphs and create metrics. Used in conjunction with time series databases such as InfluxDB, Prometheus, Elasticsearch, and Grafana can use plugins as templates and ready-made graphs and metrics.
Grafana provides the following opportunities:
Data Visualization: This allows for fast and flexible visualization with many options and settings.
Dynamic Dashboards: Provides the ability to create dynamic and reusable panels with templated variables.
Metrics Exploration: Explore your data with ad-hoc queries and dynamic drill-down by splitting the view and comparing different time ranges and sources.
Extensive Alert Capabilities: Visually define alert rules for your most important metrics. Grafana will continuously evaluate and send notifications to systems such as Slack, PagerDuty, VictorOps, and OpsGenie.
Mixed Data Sources: Mix different data sources on the same graph and for each query.
Data Logs: Provides tremendous opportunities to use data metrics in a log with labels and filters saved, which can be studied, viewed, and broadcasted.
In this lesson, we are going to learn how to install Grafana in Ubuntu 18, 20, or 22. Have your Ubuntu instance running with the user who has sudo rights. You can run one on Angani Cloud at an affordable price.
Requirments
4 GB RAM server
Ubuntu 18.04|20.04| 22.04 Server
Root user or a user with root privileges
We kick off with a system update:
root@admin:~$ sudo apt update -y  && sudo  apt upgrade -y
Hit:1 http://ke.archive.ubuntu.com/ubuntu focal InRelease
Get:2 http://ke.archive.ubuntu.com/ubuntu focal-updates InRelease [114 kB]
Get:3 http://ke.archive.ubuntu.com/ubuntu focal-backports InRelease [108 kB]
Get:4 http://ke.archive.ubuntu.com/ubuntu focal-security InRelease [114 kB]
Get:5 http://ke.archive.ubuntu.com/ubuntu focal-updates/main amd64 Packages [1,833 kB]
Get:6 http://ke.archive.ubuntu.com/ubuntu focal-updates/main amd64 c-n-f Metadata [15.4 kB]
Get:7 http://ke.archive.ubuntu.com/ubuntu focal-backports/universe amd64 Packages [23.7 kB]
Get:8 http://ke.archive.ubuntu.com/ubuntu focal-security/main amd64 Packages [1,491 kB]
Get:9 http://ke.archive.ubuntu.com/ubuntu focal-security/main Translation-en [257 kB]
Get:10 http://ke.archive.ubuntu.com/ubuntu focal-security/main amd64 c-n-f Metadata [10.4 kB]
Fetched 3,966 kB in 4s (969 kB/s)
Reading package lists... Done
Building dependency tree
Reading state information... Done
103 packages can be upgraded. Run 'apt list --upgradable' to see them.
Reading package lists... Done
Building dependency tree
Reading state information... Done
We then head off to install the essential packages (apt-transport-https and software-properties-common) for the correct running of Grafana:
$ sudo apt install -y apt-transport-https software-properties-common wget
Reading package lists... Done
Building dependency tree
Reading state information... Done
software-properties-common is already the newest version (0.99.9.8).
software-properties-common set to manually installed.
wget is already the newest version (1.20.3-1ubuntu2).
wget set to manually installed.
The following package was automatically installed and is no longer required:
libfwupdplugin1
Use 'sudo apt autoremove' to remove it.
The following NEW packages will be installed:
apt-transport-https
0 upgraded, 1 newly installed, 0 to remove and 0 not upgraded.
Need to get 1,704 B of archives.
After this operation, 162 kB of additional disk space will be used.
Get:1 http://ke.archive.ubuntu.com/ubuntu focal-updates/universe amd64 apt-transport-https all 2.0.8 [1,704 B]
Fetched 1,704 B in 0s (6,035 B/s)
Selecting previously unselected package apt-transport-https.
(Reading database ... 72085 files and directories currently installed.)
Preparing to unpack .../apt-transport-https_2.0.8_all.deb ...
Unpacking apt-transport-https (2.0.8) ...
Setting up apt-transport-https (2.0.8) ...
As Grafana is not in the default repository package, we must add the GPG key to the trusted keys. This step verifies the download came from the expected source.
$ wget -q -O - https://packages.grafana.com/gpg.key | apt-key add -
OK
Now add the repository where we will install Grafana.
$ echo "deb https://packages.grafana.com/oss/deb stable main" | tee -a /etc/apt/sources.list.d/grafana.list
deb https://packages.grafana.com/oss/deb stable main
Now we update the cache repository. Once done we proceed to install Grafana using the APT command as below
sudo apt update
sudo apt install grafana
Reading package lists... Done
Building dependency tree
Reading state information... Done
The following package was automatically installed and is no longer required:
libfwupdplugin1
Use 'sudo apt autoremove' to remove it.
The following additional packages will be installed:
fontconfig-config fonts-dejavu-core libfontconfig1
The following NEW packages will be installed:
fontconfig-config fonts-dejavu-core grafana libfontconfig1
0 upgraded, 4 newly installed, 0 to remove and 0 not upgraded.
Need to get 79.1 MB of archives.
After this operation, 265 MB of additional disk space will be used.
Do you want to continue? [Y/n] y
Get:1 http://ke.archive.ubuntu.com/ubuntu focal/main amd64 fonts-dejavu-core all 2.37-1 [1,041 kB]
Get:2 http://ke.archive.ubuntu.com/ubuntu focal/main amd64 fontconfig-config all 2.13.1-2ubuntu3 [28.8 kB]
Get:3 http://ke.archive.ubuntu.com/ubuntu focal/main amd64 libfontconfig1 amd64 2.13.1-2ubuntu3 [114 kB]
Get:4 https://packages.grafana.com/oss/deb stable/main amd64 grafana amd64 8.5.4 [77.9 MB]
Fetched 79.1 MB in 1min 5s (1,221 kB/s)
Selecting previously unselected package fonts-dejavu-core.
(Reading database ... 72089 files and directories currently installed.)
Preparing to unpack .../fonts-dejavu-core_2.37-1_all.deb ...
Unpacking fonts-dejavu-core (2.37-1) ...
Selecting previously unselected package fontconfig-config.
Preparing to unpack .../fontconfig-config_2.13.1-2ubuntu3_all.deb ...
Unpacking fontconfig-config (2.13.1-2ubuntu3) ...
Selecting previously unselected package libfontconfig1:amd64.
Preparing to unpack .../libfontconfig1_2.13.1-2ubuntu3_amd64.deb ...
Unpacking libfontconfig1:amd64 (2.13.1-2ubuntu3) ...
Selecting previously unselected package grafana.
Preparing to unpack .../grafana_8.5.4_amd64.deb ...
Setting up fonts-dejavu-core (2.37-1) ...
Setting up fontconfig-config (2.13.1-2ubuntu3) ...
Setting up libfontconfig1:amd64 (2.13.1-2ubuntu3) ...
Setting up grafana (8.5.4) ...
Adding system user `grafana' (UID 113) ...
Adding new user `grafana' (UID 113) with group `grafana' ...
Not creating home directory `/usr/share/grafana'.
### NOT starting on installation, please execute the following statements to configure grafana
to start automatically using systemd
 sudo /bin/systemctl daemon-reload
sudo /bin/systemctl enable grafana-server
### You can start grafana-server by executing
 sudo /bin/systemctl start grafana-server
Processing triggers for systemd (245.4-4ubuntu3.17) ...
Processing triggers for man-db (2.9.1-1) ...
Processing triggers for libc-bin (2.31-0ubuntu9.9) ...
To check on the version installed run the below command
$ grafana-server -v
Version 8.5.4 (commit: 78ee958143, branch: HEAD)
We enable Grafana-server to allow it to automatically start if the server reboots
$ sudo systemctl enable grafana-server

Synchronizing state of grafana-server.service with SysV service script with /lib/systemd/systemd-sysv-install.
Executing: /lib/systemd/systemd-sysv-install enable grafana-server
Created symlink /etc/systemd/system/multi-user.target.wants/grafana-server.service → /lib/systemd/system/grafana-server.service.
We then start the service for Grafana to work properly
$ sudo systemctl start grafana-serverFirewall Configuration
We will have to configure the firewall to allow port 3000 (for grafana) if the firewall on your server is active. Grafana runs on port 3000 by default. We’ll need to allow access to this port using the command below
$ sudo ufw allow 3000/tcp
Rules updated
Rules updated (v6)
$ sudo ufw reload
Firewall reloaded
Now that we are done with the installation of Grafana, we can access it. To do so, you need to open your browser and enter the IP or FQDN of your Grafana server:
http://server_IP:3000 or http://FQDN:3000
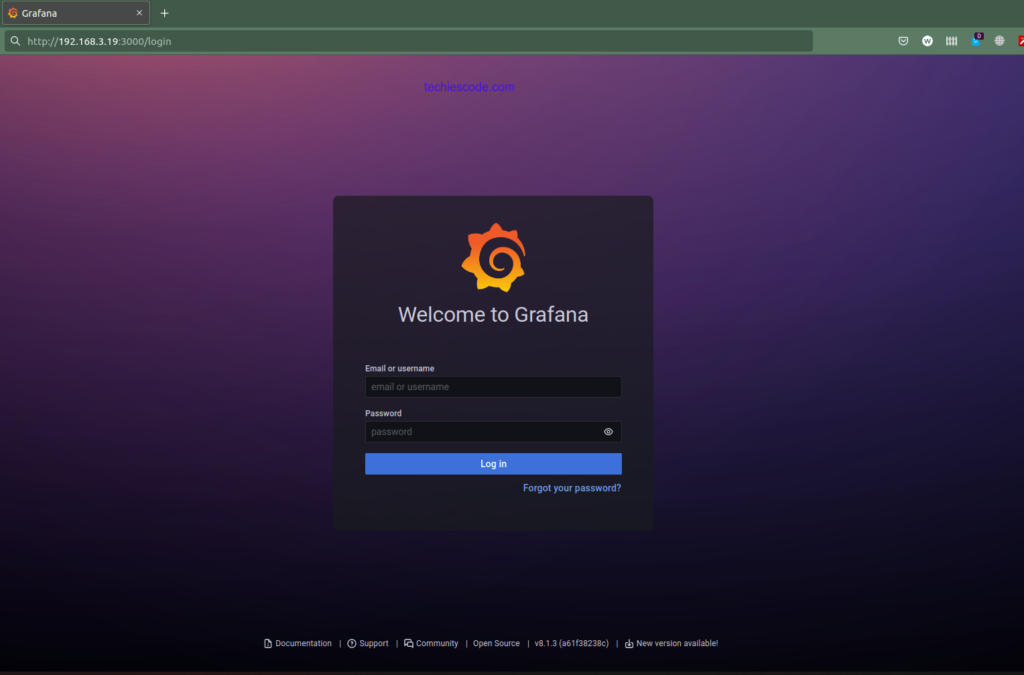
The default username and password are admin. After that, you will be prompted to change the default password. This will let you access directly to your dashboard.
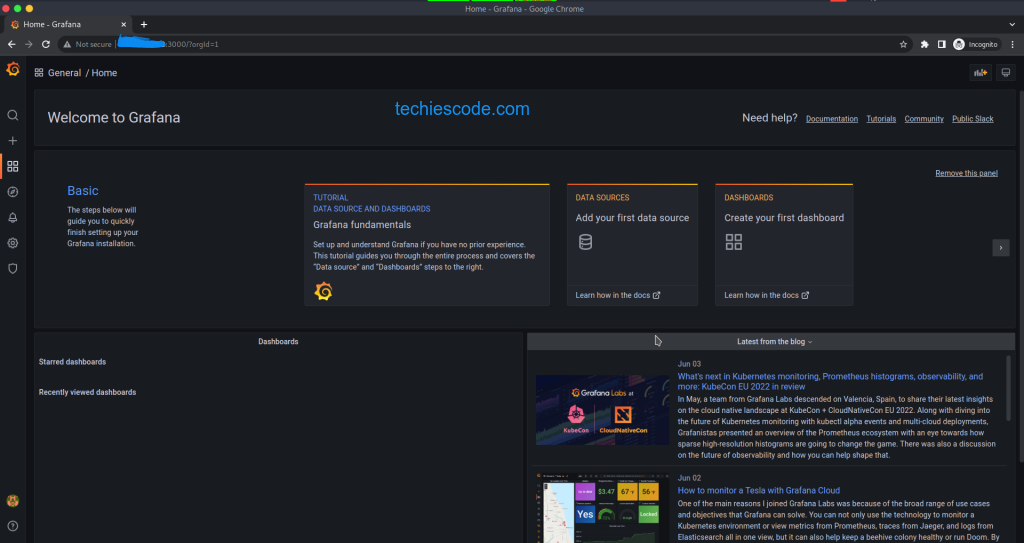
You can now start working on your Grafana and set up everything. You can have a look at the official documentation if you need some guides for your configuration.
Conclusion
In this tutorial, we learned how to install Grafana on Ubuntu 20.04. Thanks for reading.
Don’t miss to check out interesting documents you could have missed out:
How to install vsftpd on ubuntu 20.04

It is awesome. Thank you.