Techie Code is focusing on covering a wide range of IT resources, and technology trends. In this article Techies Code will take you through how to install Prometheus, an open-source real-time system event monitoring and alerting system. It records real-time metrics in a time-series database built using the HTTP pull model, with flexible queries and real-time alerting.
Features of Prometheus.
- Dimensional data – Implements a highly dimensional data model where time series are identified by a metric name and a set of key-value pairs.
- Simple Operation – Each server is independent for reliability, relying only on local storage.
- Powerful Queries – PromQL allows slicing and dicing of collected time series data in order to generate ad-hoc graphs, tables, and alerts.
- Precise Alert – Alerts are based on Prometheus’s flexible PromQL and maintain dimensional information.
- Great VIsualization – Can visualize with the use of Grafana integration and template language.
- Many Client Libraries – Over ten program languages are already supported and custom libraries are easy to implement.
- Many Integration – Works with other third-party systems such as HAProxy, Docker, statsD, and JMX metrics.
- Efficient Storage – Scaling is achieved by sharding and federation.
Step 1: Create Prometheus system User and Group
Run below command in terminal to add Prometheus group in the system.
$ sudo groupadd --system prometheusCreate user Prometheus and assign the user to the Prometheus group you created earlier.
$ sudo useradd -s /sbin/nologin --system -g prometheus prometheusStep 2: Create Prometheus Configs and Data Directories.
Create a directory where Prometheus will be able to store its data.
$ sudo mkdir /var/lib/prometheusSince Prometheus will have some directories where the primary configuration file will be, let’s create sub-directories.
$ for i in rules rules.d files_sd; do sudo mkdir -p /etc/prometheus/${i}; doneStep 3: Download the Latest Version of Prometheus in Ubuntu
First, we need to make sure we have curl, wget, and vim commands installed as we will use them in downloading our file and some editing.
sudo apt update
sudo apt -y install wget curl vim
You get the latest version of Prometheus from the official GitHub repository
#Create a folder where you will download prometheus archived file then navigate to it
mkdir -p /tmp/prometheus && cd /tmp/prometheus
#Use curl or wget to download the file
curl -s https://api.github.com/repos/prometheus/prometheus/releases/latest | grep browser_download_url | grep linux-amd64 | cut -d '"' -f 4 | wget -qi -
Extract the file
$ tar xvf prometheus*.tar.gz

prometheus-2.36.2.linux-amd64/
prometheus-2.36.2.linux-amd64/consoles/
prometheus-2.36.2.linux-amd64/consoles/index.html.example
prometheus-2.36.2.linux-amd64/consoles/node-cpu.html
prometheus-2.36.2.linux-amd64/consoles/node-disk.html
prometheus-2.36.2.linux-amd64/consoles/node-overview.html
prometheus-2.36.2.linux-amd64/consoles/node.html
prometheus-2.36.2.linux-amd64/consoles/prometheus-overview.html
prometheus-2.36.2.linux-amd64/consoles/prometheus.html
prometheus-2.36.2.linux-amd64/console_libraries/
prometheus-2.36.2.linux-amd64/console_libraries/menu.lib
prometheus-2.36.2.linux-amd64/console_libraries/prom.lib
prometheus-2.36.2.linux-amd64/prometheus.yml
prometheus-2.36.2.linux-amd64/LICENSE
prometheus-2.36.2.linux-amd64/NOTICE
prometheus-2.36.2.linux-amd64/prometheus
prometheus-2.36.2.linux-amd64/promtool
root@ubuntu18:/tmp/prometheus#
#Naviate to new generated folder.
cd prometheus*/
Move files to the binary folder.
$ sudo mv prometheus promtool /usr/local/bin/Now confirm the version of your installed Prometheus.
$ prometheus --version

prometheus, version 2.36.2 (branch: HEAD, revision: d7e7b8e04b5ecdc1dd153534ba376a622b72741b)
build user:       root@f051ce0d6050
build date:       20220620-13:21:35
go version:       go1.18.3
platform:         linux/amd64
$ promtool --version
promtool, version 2.36.2 (branch: HEAD, revision: d7e7b8e04b5ecdc1dd153534ba376a622b72741b)
build user:       root@f051ce0d6050
build date:       20220620-13:21:35
go version:       go1.18.3
platform:         linux/amd64
Move the following Prometheus files to “/etc” directory.
sudo mv prometheus.yml /etc/prometheus/prometheus.yml
sudo mv consoles/ console_libraries/ /etc/prometheus/
cd
Step 4: Configuring Prometheus on Ubuntu 22.04|20.04|18.04
Create a backup of your configuration file and edit your file to match your preferences
cp /etc/prometheus/prometheus.yml /etc/prometheus/prometheus.yml.bak
vim /etc/prometheus/prometheus.yml
Your file should look like this one.
# my global config
global:
scrape_interval: 15s # Set the scrape interval to every 15 seconds. Default is every 1 minute.
evaluation_interval: 15s # Evaluate rules every 15 seconds. The default is every 1 minute.
# scrape_timeout is set to the global default (10s).
# Alertmanager configuration
alerting:
alertmanagers:
- static_configs:
- targets:
# - alertmanager:9093
# Load rules once and periodically evaluate them according to the global 'evaluation_interval'.
rule_files:
# - "first_rules.yml"
# - "second_rules.yml"
# A scrape configuration containing exactly one endpoint to scrape:
# Here it's Prometheus itself.
scrape_configs:
# The job name is added as a label `job=<job_name>` to any timeseries scraped from this config.
- job_name: "prometheus"
# metrics_path defaults to '/metrics'
# scheme defaults to 'http'.
static_configs:
- targets: ["localhost:9090"]
Modify where necessary.
Create Systemd Service File for Prometheus
sudo tee /etc/systemd/system/prometheus.service<<EOF
[Unit]
Description=Prometheus
Documentation=https://prometheus.io/docs/introduction/overview/
Wants=network-online.target
After=network-online.target
[Service]
Type=simple
User=prometheus
Group=prometheus
ExecReload=/bin/kill -HUP \$MAINPID
ExecStart=/usr/local/bin/prometheus \
--config.file=/etc/prometheus/prometheus.yml \
--storage.tsdb.path=/var/lib/prometheus \
--web.console.templates=/etc/prometheus/consoles \
--web.console.libraries=/etc/prometheus/console_libraries \
--web.listen-address=0.0.0.0:9090 \
--web.external-url=
SyslogIdentifier=prometheus
Restart=always
[Install]
WantedBy=multi-user.target
EOF
Change Directory Permission and assign ownership permission of directories to user prometheus.
for i in rules rules.d files_sd; do sudo chown -R prometheus:prometheus /etc/prometheus/${i}; done
for i in rules rules.d files_sd; do sudo chmod -R 775 /etc/prometheus/${i}; done
sudo chown -R prometheus:prometheus /var/lib/prometheus
Reload the daemon to apply changes then restart Prometheus.
sudo systemctl daemon-reload
sudo systemctl start prometheus
sudo systemctl enable prometheus
Check status and confirm that Prometheus is now running.
$ sudo systemctl status prometheus

● prometheus.service - Prometheus
Loaded: loaded (/etc/systemd/system/prometheus.service; enabled; vendor preset: enabled)
Active: active (running) since Wed 2022-06-22 18:31:15 EAT; 1min 31s ago
Docs: https://prometheus.io/docs/introduction/overview/
Main PID: 30680 (prometheus)
Tasks: 9 (limit: 4915)
CGroup: /system.slice/prometheus.service
└─30680 /usr/local/bin/prometheus --config.file=/etc/prometheus/prometheus.yml --storage.tsdb.path=/var/lib/prometheus --web.console.templates=/etc/prometheus/consoles --web.console.libraries=/etc/pro
Jun 22 18:31:17 ubuntu18 prometheus[30680]: ts=2022-06-22T15:31:17.240Z caller=head.go:536 level=info component=tsdb msg="On-disk memory mappable chunks replay completed" duration=68.401µs
Jun 22 18:31:17 ubuntu18 prometheus[30680]: ts=2022-06-22T15:31:17.240Z caller=head.go:542 level=info component=tsdb msg="Replaying WAL, this may take a while"
Jun 22 18:31:17 ubuntu18 prometheus[30680]: ts=2022-06-22T15:31:17.240Z caller=head.go:613 level=info component=tsdb msg="WAL segment loaded" segment=0 maxSegment=0
Jun 22 18:31:17 ubuntu18 prometheus[30680]: ts=2022-06-22T15:31:17.241Z caller=head.go:619 level=info component=tsdb msg="WAL replay completed" checkpoint_replay_duration=52.421µs wal_replay_duration=943.985µs t
Jun 22 18:31:17 ubuntu18 prometheus[30680]: ts=2022-06-22T15:31:17.243Z caller=main.go:993 level=info fs_type=EXT4_SUPER_MAGIC
Jun 22 18:31:17 ubuntu18 prometheus[30680]: ts=2022-06-22T15:31:17.243Z caller=main.go:996 level=info msg="TSDB started"
Jun 22 18:31:17 ubuntu18 prometheus[30680]: ts=2022-06-22T15:31:17.243Z caller=main.go:1177 level=info msg="Loading configuration file" filename=/etc/prometheus/prometheus.yml
Jun 22 18:31:17 ubuntu18 prometheus[30680]: ts=2022-06-22T15:31:17.245Z caller=main.go:1214 level=info msg="Completed loading of configuration file" filename=/etc/prometheus/prometheus.yml totalDuration=2.091534
Jun 22 18:31:17 ubuntu18 prometheus[30680]: ts=2022-06-22T15:31:17.245Z caller=main.go:957 level=info msg="Server is ready to receive web requests."
Jun 22 18:31:17 ubuntu18 prometheus[30680]: ts=2022-06-22T15:31:17.245Z caller=manager.go:937 level=info component="rule manager" msg="Starting rule manager..."
lines 1-19/19 (END)
Since Prometheus runs on port 9090, you will need to allow this port in the firewall if you have it running.
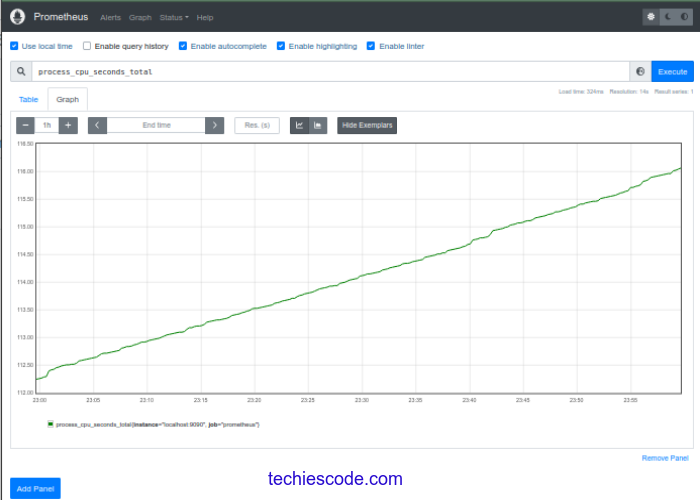
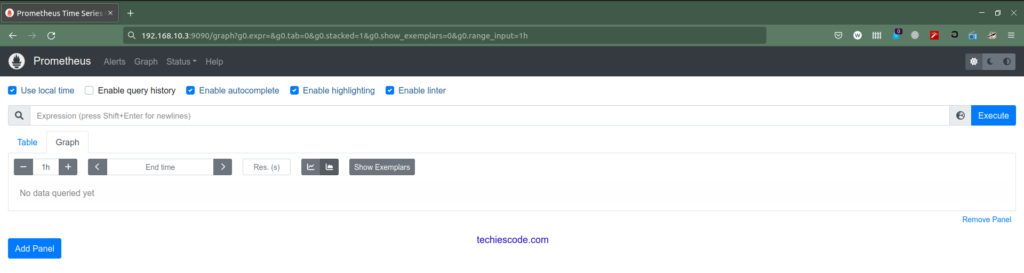
$ sudo ufw allow 9090/tcpVisit your browser using FQDN or Server_IP on port 9090 to access the Prometheus web console.
http://example.com:9090 or https://192.168.10.3:9090
Follow us o the next article where we will cover how you can secure Prometheus with login authentication.
How to Install Grafana in Ubuntu 18.04|20.04|22.04